

There's an Algo For That
Machine learning applications in the investment biz

Machine learning and its associated jargon seem to be transcending from academia, IT departments and internet chats to the mainstream. I’ve started noticing these computational methods mentioned more often during my own internet perusal and I thought some of the related concepts would be entertaining for you to ponder over this weekend. Artificial Intelligence started as a buzzword, but now you hear related terminology applied frequently during S&P 500 constituent earnings calls:
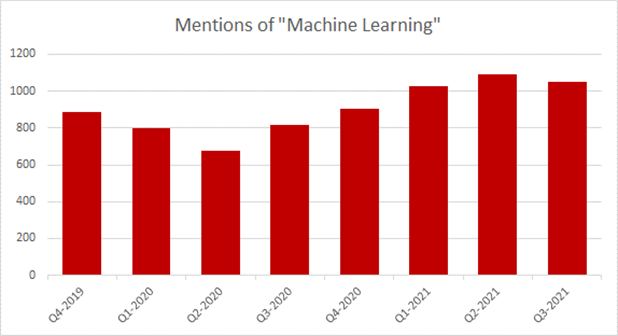
Interestingly, this is all going down while labour markets are clamouring for workers and flies in the face of conventional wisdom that artificial intelligence is going to send us all to the unemployment line. For over two centuries, pundits have claimed that robots would steal our jobs and if anything, the ML industry is suffering from a lack of workers:

Alon Bochman of Genpact wrote for Enterprising Investor recently. His note focuses on a few common issues they frequently encounter while helping investment advisors transform their businesses for success in a more digital world. The article walks readers through a case study that ended up reducing the time it takes to qualify a prospect from 40 minutes to almost instantly. After the consultation, the client anticipates outbound activity will grow by 30% and inflows by 10% to 15% within a year.
The typical IAs workflow involves oversight of existing positions & considering new investments (macro, earnings/guidance updates, industry trends, ESG, IPOs, etc.). In addition, there are considerable non-portfolio tasks like client retention, business development & talent management. All of this involves a ton of information so Genpact begins their work by setting up a new data architecture and establishing a business intelligence team:
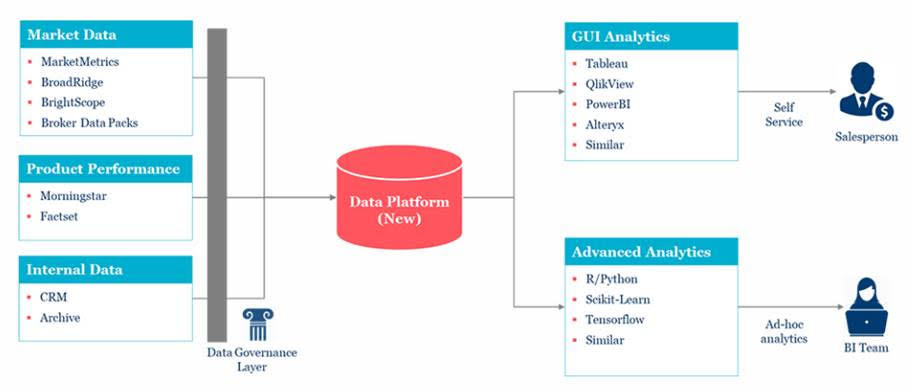
After the new systems were in place, consultants worked with some of the more senior sales people, leveraging their domain knowledge, experience and skill to create a new set of reports and “drive decisions about who to call and what to pitch”. With these tools established, the data scientists were unleashed to observe how they were being used and uncover additional patterns using statistical methods.

As an investor in companies that are undergoing similar transitions there are some important findings in this case study:
Modernizing a company’s digital strategy takes time. There’s a sequence of events where later tasks depend on the successful completion of the prior work
Human input is essential and the tools enhance labour more than replace it
Framing the problem/outcome is a nuance that needs to be taken seriously. Running optimization algos for the wrong problem can have serious consequences
The benefits can be huge
In addition to uncovering patterns, machine learning techniques can be used to group seemingly disparate sets of data. The folks over at Quantpedia seek to convert academic research into tangible tools for investors. They published a neat series of blog posts recently about clustering as an approach to creating a risk parity portfolio. As a reminder, in such an allocation, you’re trying to weight assets such that their relative volatility contributions are equal. However, as we can see below, the mix of assets will cause the overall risk/return of the portfolio to vary:
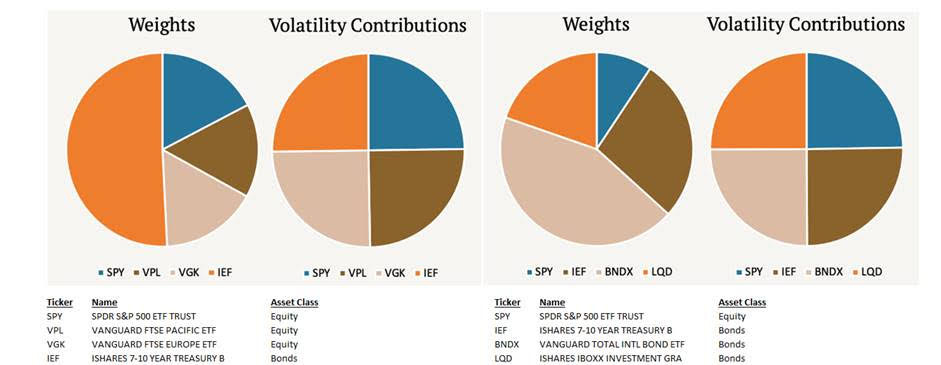
A naïve approach to risk parity is sensitive to the frequency of assets in each class. You could go through & manually classify the funds in your investable universe into groups (equity-like, bond-like, commodity-like, etc.) but this would be cumbersome, so it’s better to use algorithms. The linked three-part series is a bit technical (especially Part 2), but if you can look past the jargon, then it’s fairly interesting . Here’s a summary of Part 1:
Of the countless ways to split-up data, there isn’t a one-size-fits-all solution. Yes, you’re trying to build a tool that will generalize, but it requires a custom touch
Typically, it’s a best practice to evaluate several models and compare their various strengths/weaknesses
Part 3 is likely the most appealing installment as it outlines how different clustering methods can generate a wide spectrum of results. Below I show the outcomes from the algorithms’ division of eight different ETFs into an optimal number of categories and subsequent weighting of the groups according to risk parity:
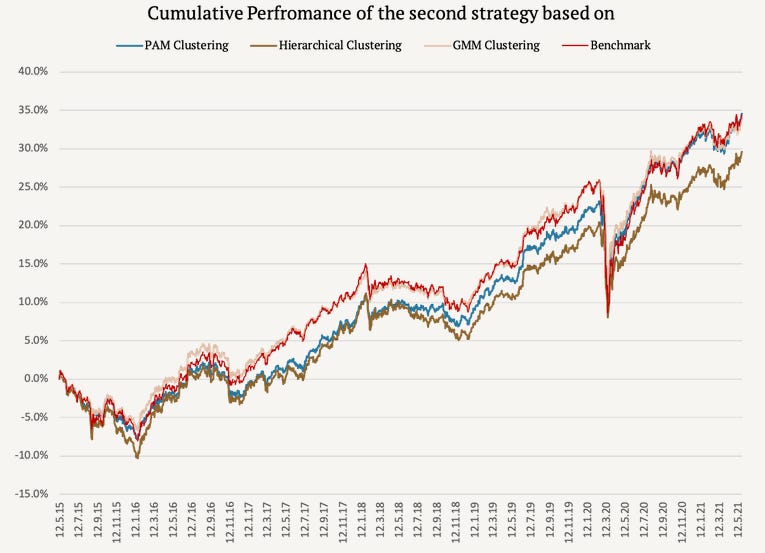
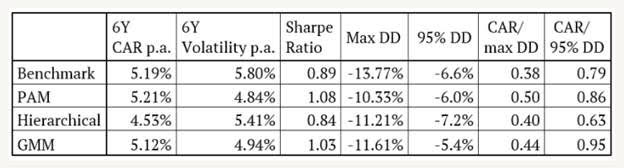
There can be a big difference in outcomes depending on the algorithm employed. We notice that Hierarchical clustering underperformed; due largely to its overweighting commodities, which had a rough go during the analysis period. However, an underachieving method in this case study could very well lead to superior performance in other years.
Clustering is a scalable way to separate the large datasets that are frequent in finance. The authors note that this approach shouldn’t be used to identify outperforming assets, but it can be helpful in risk management to gauge the level of your portfolio’s diversification. You might hold dozens of securities, but are they all related to a few factors/strategies?
A group of European researchers recently published a paper summarizing their attempts to predict a mutual fund’s relative performance ex ante. This is the kind of edge, that if successful, would likely be whittled away quickly, but it’s also pretty good click bait for stock market nerds. The authors find that by using models based on ensembles of decision trees (which are effectively series of if-then statements) they can identify with decent accuracy, the top decile funds next year.
The language in the paper isn’t too academic, so it’s actually readable for those interested. It’s kind of neat to see how the different variables change in importance over time, which makes sense given the nature of markets. It’s also unsurprising then, that the process involved relatively high turnover. The top decile typically saw 60% - 70% of the funds turnover.
Some of the factors used in their analysis are expense ratio, total assets, flows, momentum and the classic Fama & French model. All methods select funds with above average flows, turnover, and value added (alpha plus fees). They also tend to select funds with below-average betas. Interestingly, they select funds that are about 0.2 standard deviations more expensive than the average. What’s important to note is that using ML techniques permits for the identification of future outperformers whereas traditional linear methods were only able to identify the funds to avoid.
As mentioned above, clearly defining the problem and desired outcome are essential to applied machine learning. Improper treatment here can have severe consequences as Oleg Novikov explained in this note “How I Built A Perfect Model And Got Into Trouble.” It’s a fun read and while there’s a bit of statistics/machine learning vernacular, the main takeaways are evident even if you’re unfamiliar with that language.
In essence, the analyst’s model was optimized to predict whether a certain customer would click on a product they were shown. Based on that appraisal the user would be displayed a products with the highest expected click-through-rate first, with the idea that this would maximize sales. However, in an A|B test they noticed an unexpected consequence – the click-bait was resulting in window-shopping behavior and sales dropped.
The great thing about models is that they’re relatively easy to tweak so Mr. Novikov adjusted his approach to predict purchases instead of clicks and received “twice as many orders in the treatment group!” However, this model was also flawed…. Purchases were up, but basket size shrunk in half. Turns out, the most important feature in the model predicting a “buy” was price and this prioritized cheap products.
Eventually they settled on trying to minimize returns and this had the two-fold improvement of not impacting site traffic while lowering costs. There were some interesting consequences of working through these motions too:

I was thinking about the story above in context of robo-advisors. Are there ethical considerations of A|B testing someone’s financial well-being?
Have a great weekend!